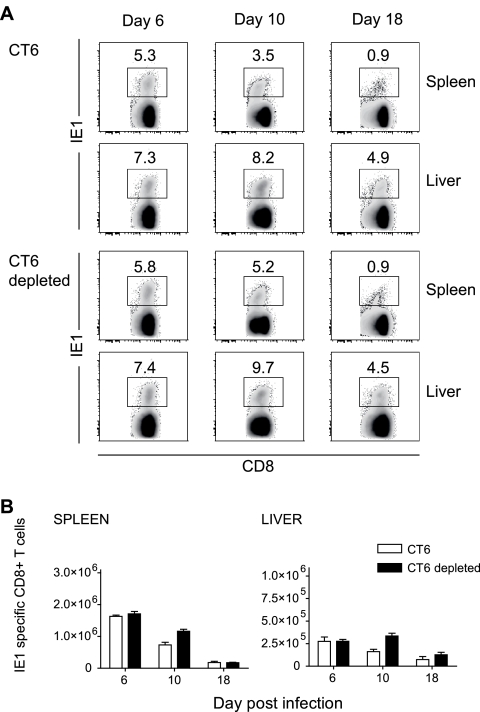
FIG. 4.
Frequencies and numbers of IE1-specific CD8+ T cells in the spleens and livers of mice lacking NK cells. CT6 mice treated with an irrelevant immunoglobulin or with the anti-NK1.1 PK136 monoclonal antibody prior to infection with 102 PFU mCMV were used for these experiments. (A) Frequencies of IE1-specific CD8+ T cells at days 6, 10, and 18 after infection were determined by FACS staining with TCRβ-APC, CD8α-APC-Cy7, and H2-Ld IE tetramer-PE. Numbers in the density plots indicate the mean frequencies of IE1+ cells in the CD8 T-cell pool. Density plots are representative of six mice from two independent experiments with three mice per group. (B) Numbers of IE1-specific CD8+ T cells at days 6, 10, and 18 after infection; numbers represent the means ± SE of five to six mice from two independent experiments.

