
FIG. 5.
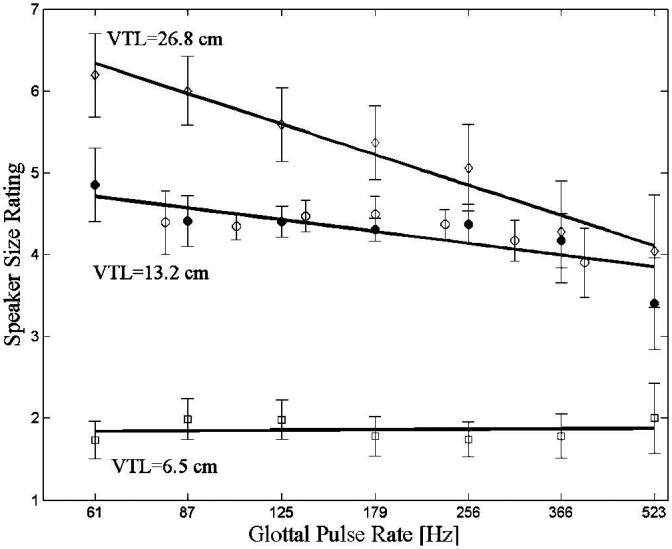
Perceived speaker size as a function of GPR, for VTLs of 6.5, 13.2, and 26.8 cm. The open and solid circles show data from the narrower and wider stimulus ranges, respectively. The solid lines show the best-fitting regression lines for perceived speaker size rating as a function of the natural logarithm of GPR. The error bars are ± one standard error of the mean (calculated from the average of the eight listeners). Each datum point is based on 200 trials.