FIG. 6.

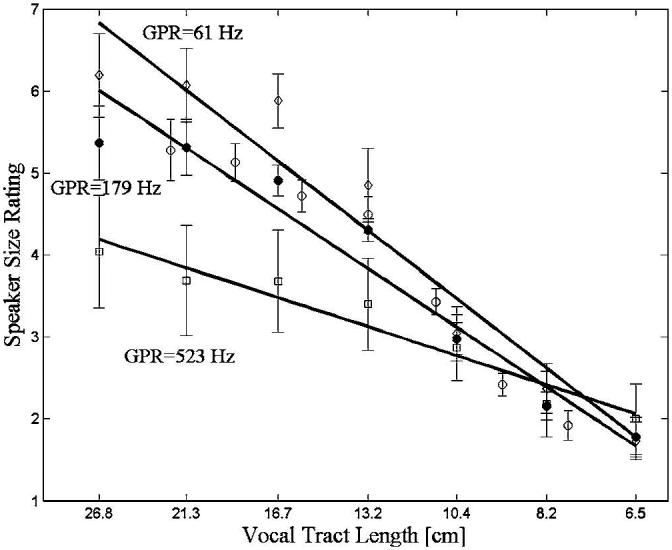
Perceived speaker size as a function of VTL, for GPRs of 61, 179, and 523 Hz. The solid lines show the best-fitting regression lines for speaker size rating as a function of the natural logarithm of VTL. For all other details see Fig. 5.

Perceived speaker size as a function of VTL, for GPRs of 61, 179, and 523 Hz. The solid lines show the best-fitting regression lines for speaker size rating as a function of the natural logarithm of VTL. For all other details see Fig. 5.