
Figure 3.
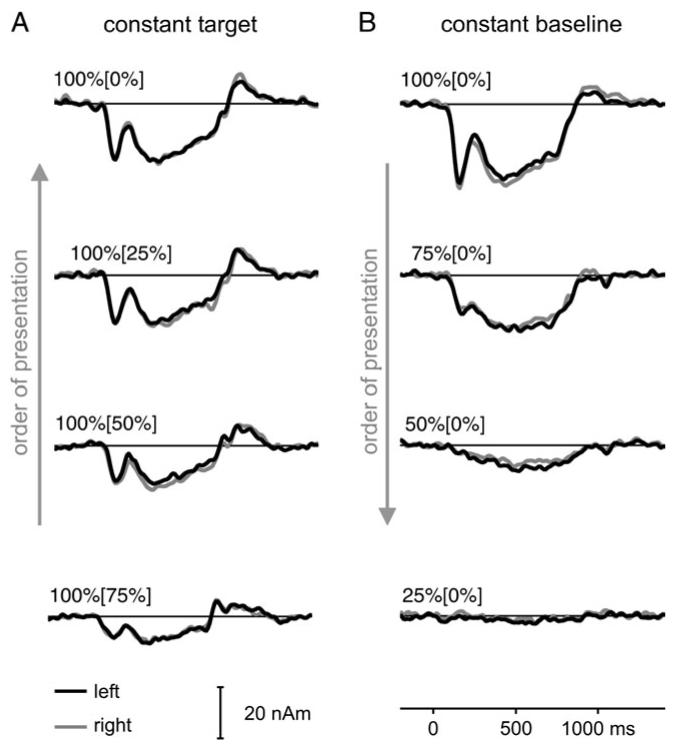
Grand average source waves for Experiment 1. Activity from the left (black) and right auditory cortex (gray) is shown in the same panel. The inserts show the regularity values for the target and, in brackets, the baseline. The data represent an average over 12 subjects, where each trace is based on 200 replications per subject. (A) Constant target regularity with variable baseline regularity. (B) Constant baseline regularity with variable target regularity. Arrows indicate the order of stimulus presentation (cf., Fig. 1).