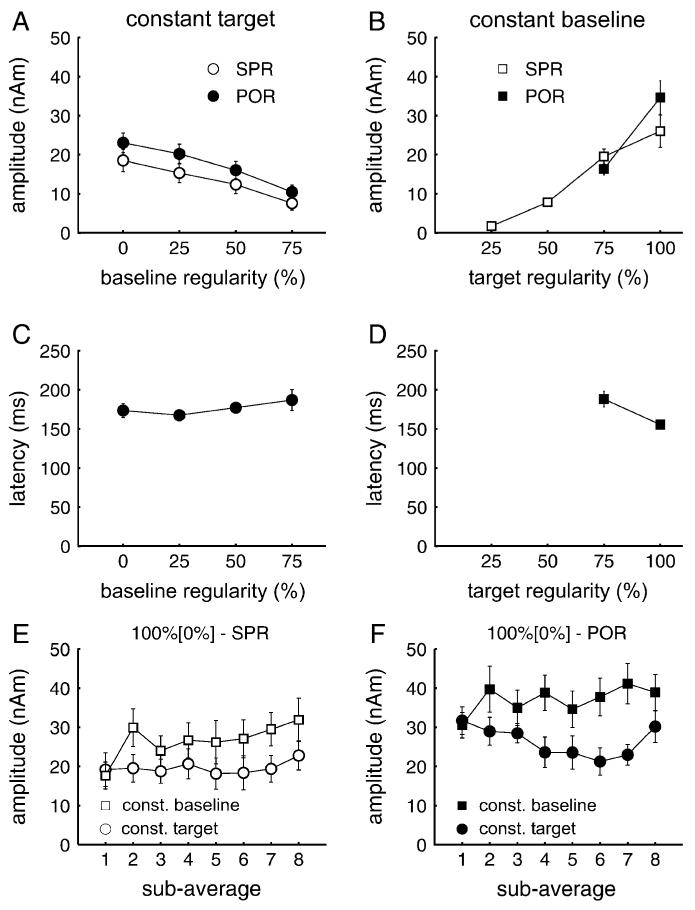
Figure 4.
(A and B) Amplitudes of the SPR (white) and POR (black). The POR was measured at its peak in the individual source waveforms of each subject (interval 80-250 ms). The SPR was measured as the average amplitude in the interval from 400 to 720 ms after target onset. (C and D) Peak latency of the POR (A, C constant baseline; B, D constant target). Mean amplitude of (E) the SPR and (F) the POR, for each of the 8 blocks of the 100% [0%] condition. Circles represent the constant target condition, squares the constant baseline condition. Error bars indicate the standard error of the mean.

