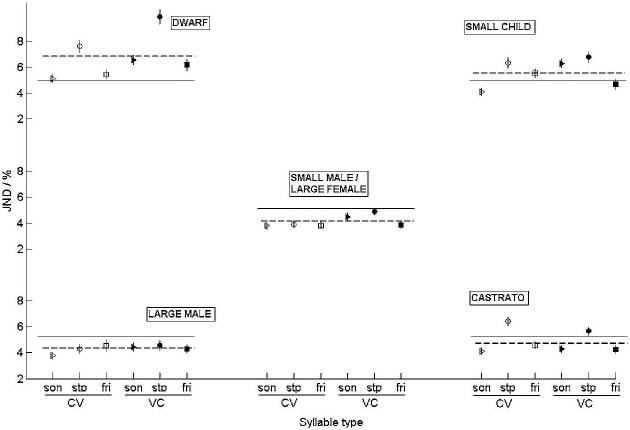
FIG. 3.
The jnd values for the six syllable groups plotted separately for the five speaker types. The layout of speaker types is the same as in Figs. 2 and 3, i.e., large male at the bottom left and small child at the top right. The dotted line is the average jnd across syllable category for that specific speaker type. The solid, thin line is grand average jnd for the experiment plotted in each subfigure for comparison with the local average.

