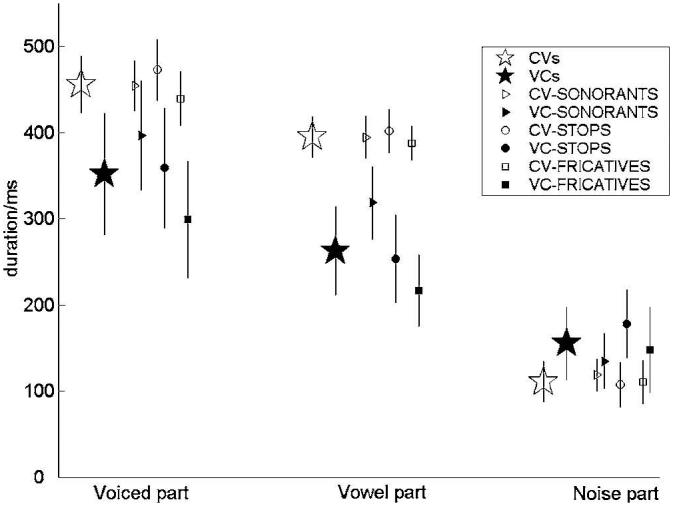
FIG. 4.

The small symbols show the duration of the “voiced,” “vowel,” and “noise” components for each of the six syllable classes with error bars showing ±2 standard deviations. The large star symbols show the average values for all of the CV syllables (open) and all of the VC syllables (filled).
