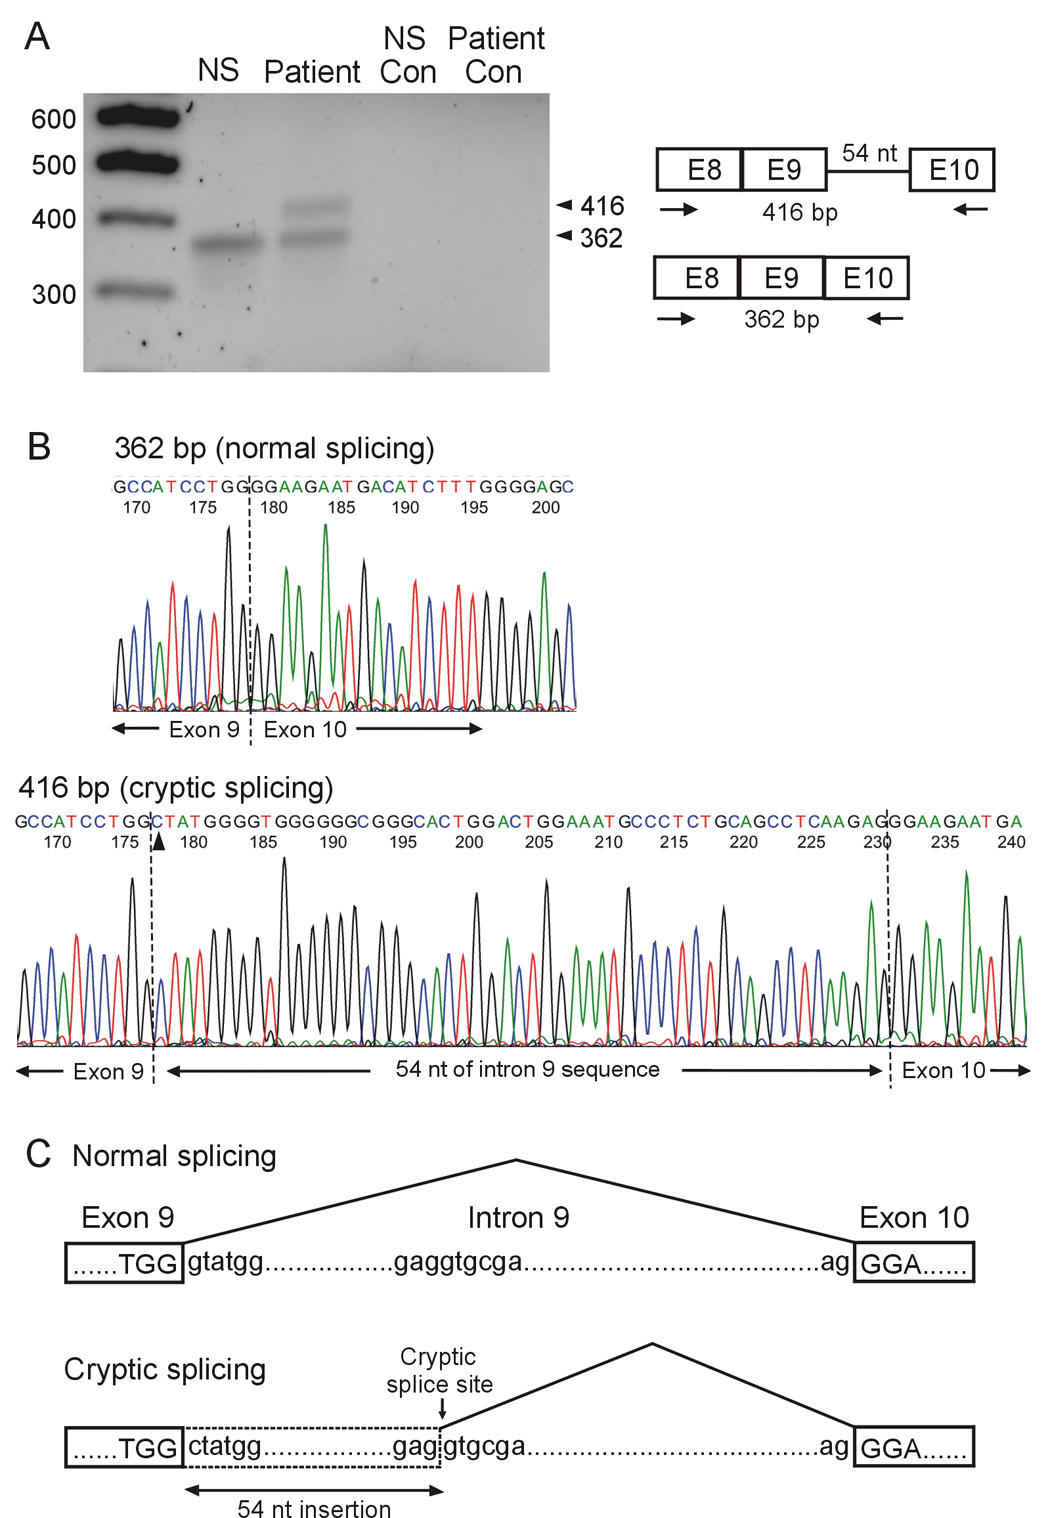
Figure 1.

RT-PCR analysis of hERG mRNA isolated from lymphocytes. A: mRNA was isolated from a normal subject (NS) and the proband of family 2. RT- PCR was performed using primers in exon 8 and exon 10 as indicated by arrows. Control lanes: no reverse transcriptase in RT reaction. Similar results were obtained from another mutation carrier of this family and two independent experiments were performed for each patient. B: Sequence analysis of the 362 bp product from a normal subject (top panel) and the 416 bp product from the proband (bottom panel). Arrow head indicates the 2398+1G>C mutation. C: Schematic presentation of normal and cryptic splicing.
