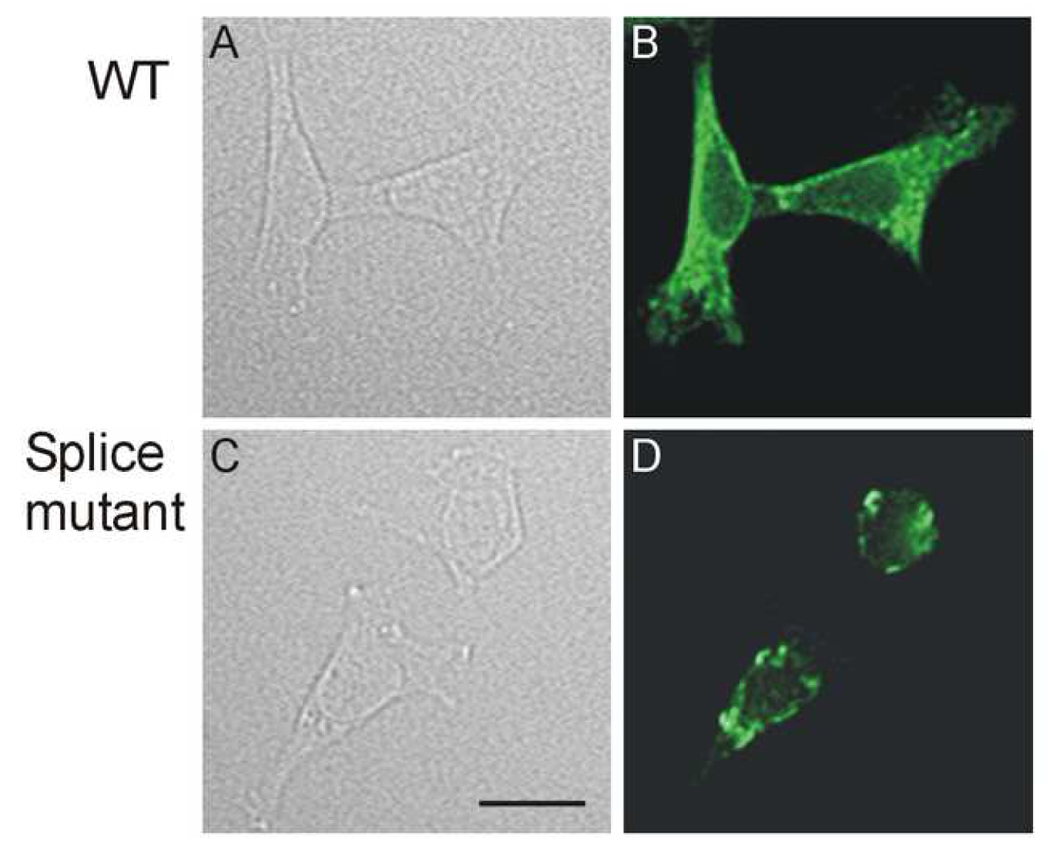
Figure 5.

Immunofluorescence staining for localization of WT and splice mutant channels. HEK239 cells were transfected with WT (A and B) and the splice mutant (C and D). For each transfection, a phase contrast photograph (A and C) and anti-hERG antibody staining (B and D) are shown. Calibration bar = 20 µm.
