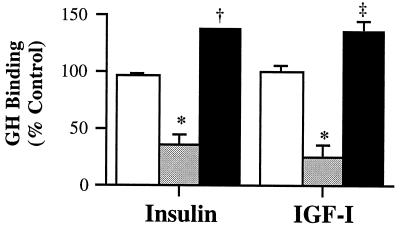
Figure 2.
GHR distribution. After treatment with insulin or IGF-I, total (□), surface (░⃞), and intracellular GH binding (▪) were determined as described in Materials and Methods. The control values for total, surface, and intracellular GH binding were 2,459 ± 209 cpm/mg, 112 ± 20 cpm/106 cells, and 1,723 ± 103 cpm/mg, respectively. Vs. control, ∗, P < 0.05; ‡, P < 0.005; and †, P = 0.0001.

