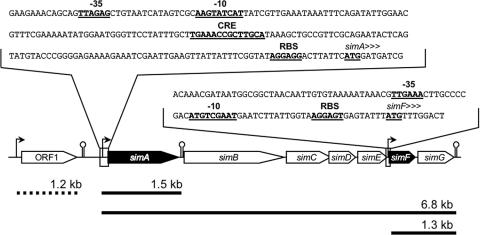
FIG. 7.
Map of the sim operon, showing the promoter regions of simA and simF. The −35 and −10 boxes of potential promoters, the translational start codons, the putative CRE site, and the ribosomal binding sites (RBS) are indicated by boldface type and underlining. The heavy solid lines indicate RNA transcripts found only in L. casei ATCC 334 cells grown on the isomers of sucrose. The heavy dashed line indicates the ORF1 transcript.

