FIG. 2.
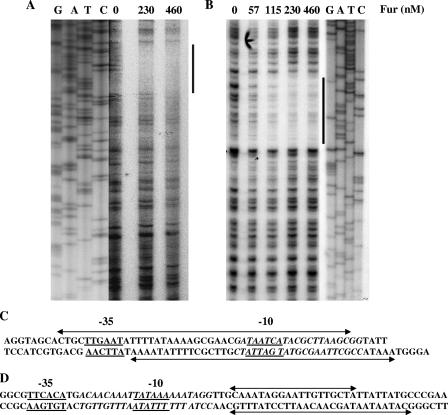
DNase I footprinting analysis of N. gonorrhoeae Fur protein with gonococcal fur and tonB promoter/operator regions. (A) DNase I footprint analysis of the fur promoter operator region. Radiolabeled DNA was incubated with increasing concentrations of Fur (0, 230, and 460 nM) prior to digestion with DNase I (indicated in the top panel). DNA standards (GATC) are shown on the left side of the panel. Fur-protected nucleotide bases are indicated by a thick line. (B) DNase I footprint analysis of the tonB promoter operator region. Radiolabeled DNA was incubated with increasing concentrations of Fur (0, 57, 115, 230, and 460 nM) prior to digestion with DNase I enzyme. The Fur-protected tonB promoter/operator region is indicated by a thick line. The Fur concentration and probes used are indicated at the top of each panel, and the DNA standards (GATC) are shown on the right side of the panel. (C) Schematic representation of a portion of the predicted fur promoter/operator region. The Fur-protected region is marked by a double-arrow line on both template and nontemplate strands. The predicted −10 and −35 promoter elements are underlined; the predicted Fur box is italicized. (D) Schematic representation of part of the predicted tonB promoter/operator region. The Fur-protected region is marked by a line with a double arrow on both template and nontemplate strands. The predicted −10 and −35 promoter elements are underlined; the predicted Fur box is italicized.

