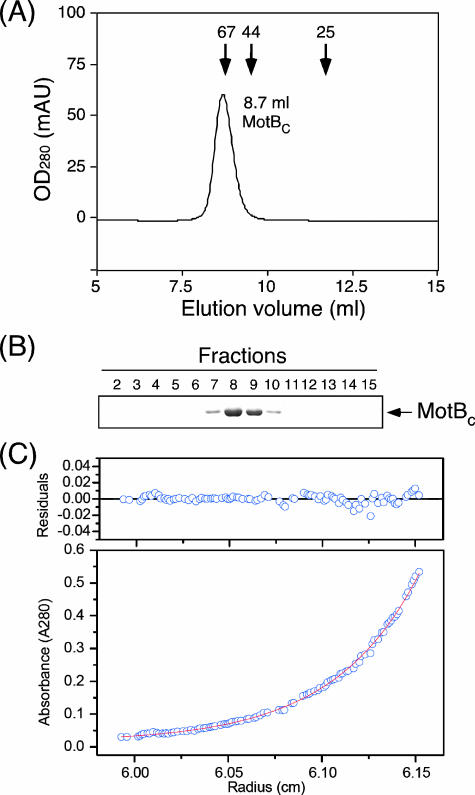
FIG. 4.
Hydrodynamic properties of MotBC protein. (A) Elution profile of purified MotBC by analytical size exclusion chromatography with a Superdex 75 HR 10/30 column. Arrows indicate the elution peaks of the marker proteins BSA (67 kDa), ovalbumin (44 kDa), and chymotrypsinogen (25 kDa) at 8.8 ml, 9.5 ml, and 11.7 ml, respectively. OD280, optical density at 280 nm; mAU, milliabsorbance units. (B) SDS-polyacrylamide gel electrophoresis of elution fractions from panel A. Fractions 7 to 10 correspond to the volume from around 7.5 to 10 ml. (C) Sedimentation equilibrium analytical ultracentrifugation of MotBC. Open circles are data points, and the continuous line is a model fit. A concentration profile of MotBC (initial absorbance at 280 nm of 0.2, measured at 24,000 rpm) is shown at the bottom. For data fitting, we performed a global fit to six data sets from two different protein concentrations and three rotor speeds. The residuals due to deviation of the data from this line are shown at the top. The molecular mass obtained was 50.6 kDa, indicating that MotBC is a dimer. Measurements were done at room temperature.

