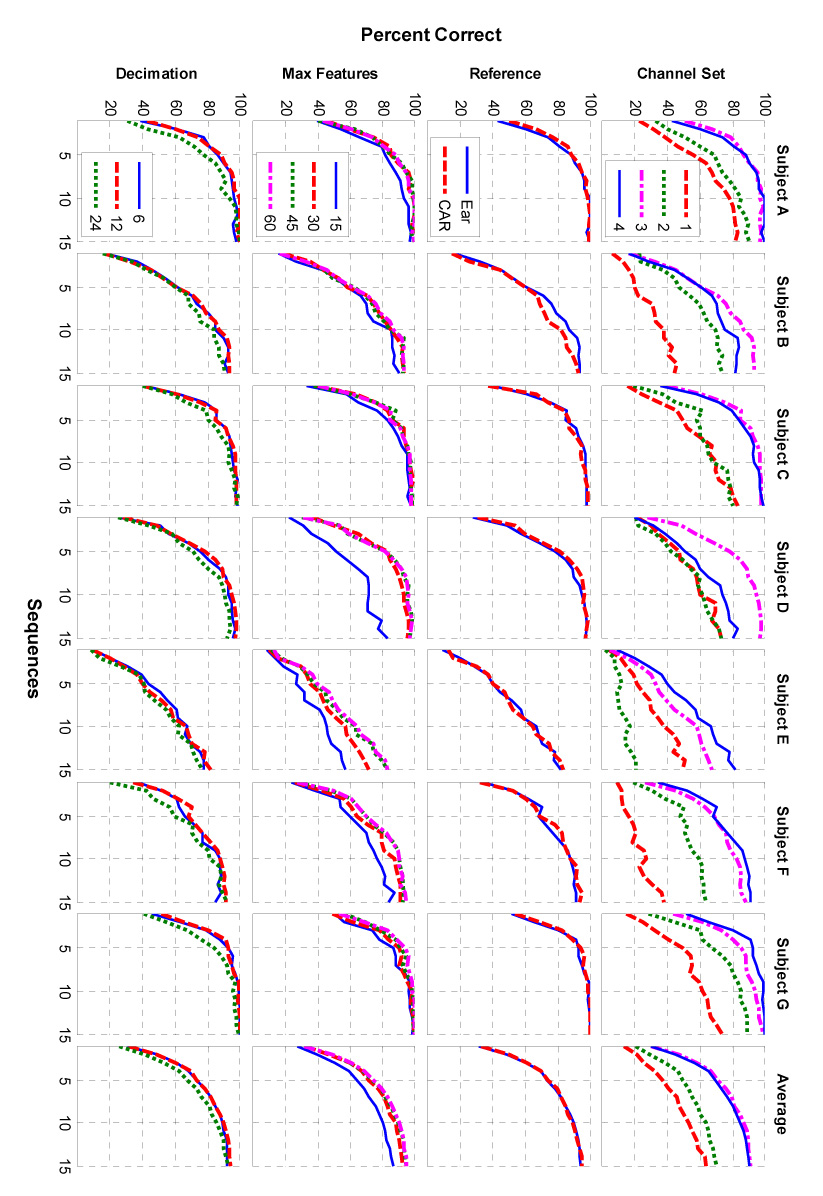
Fig. 3.

Performance curves at each level of the 4 factors for all 15 stimulus intensification sequences. Each of the 4 rows of plots indicates a single factor for each participant. The rightmost column of plots shows the average for each factor across participants.
