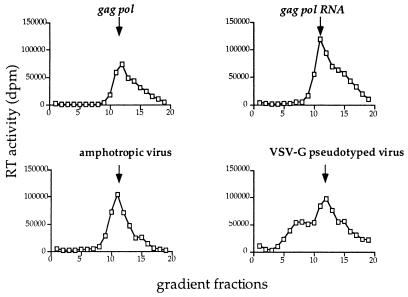
Figure 4.
RT activity (□) of fractions from velocity gradient sedimentation analysis of pelleted gag pol particles, gag pol RNA particles, amphotropic virus, and VSV-G pseudotyped virus. For each sample, RT values represent the percentage fraction of total RT loaded onto the gradient. The arrows indicate the approximate position of the 580S major peak. For the pseudotyped particles, the slower sedimenting material with a sedimentation coefficient of approximately 370S was not present in all preparations of VSV-G pseudotyped virus.

