
Figure 4.
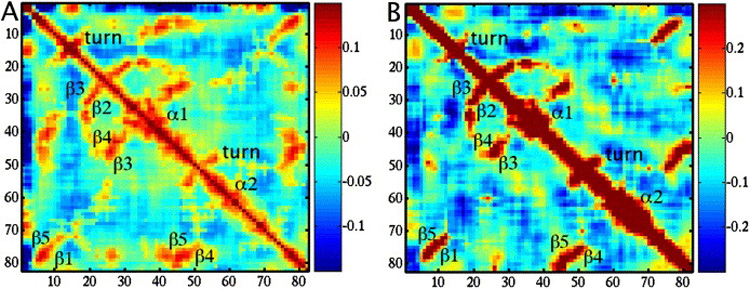
Correlation matrices generated from normal mode analyses of PDZ domain (PDB ID 1R6J). The plots show correlation between residues with indices shown on x and y axes, blue color indicating negative correlation and red signifying positive, with the range shown in the colorbars. Secondary structure elements are labeled in sequence order. A) Correlation from Anisotropic Network Model; B) from CHARMM-based Block Normal Modes. Note that the range in plot A is half that of B.