
Figure 1.
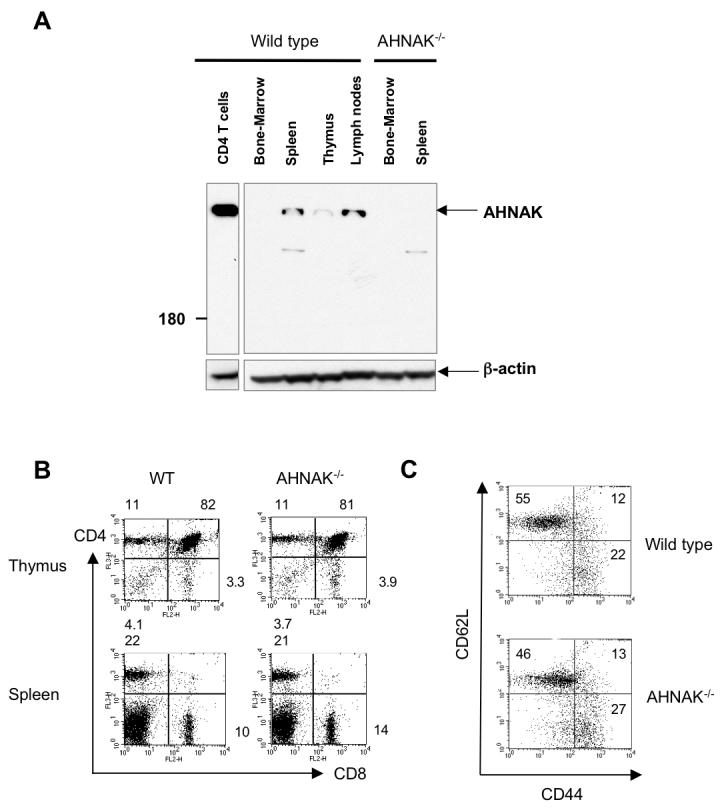
Expression of AHNAK1 in T cells. (A) Bone marrow, spleen, thymus and lymph nodes were isolated from wild-type and AHNAK1−/− mice. The expression of AHNAK1 in tissues and CD4 T cells was examined by western blot analysis using anti-AHNAK1-C2 antibody. β-actin was used for loading control. Results are representative of at least three independent experiments. (B) Normal CD4/CD8 composition of AHNAK1−/− T cells in thymus and spleen. Thymocytes/splenocytes from wild-type and AHNAK1−/− mice were prepared, stained with anti-CD4 and anti-CD8 antibodies and analyzed by flow cytometry. Results are representative of at least three independent experiments. (C) Normal memory/naïve population of AHNAK1−/− T cells. Splenocytes from both wild-type and AHNAK1−/− mice were analyzed by flow cytometry using anti-CD44 and CD62L antibody as in C. Results are representative of at least three independent experiments.