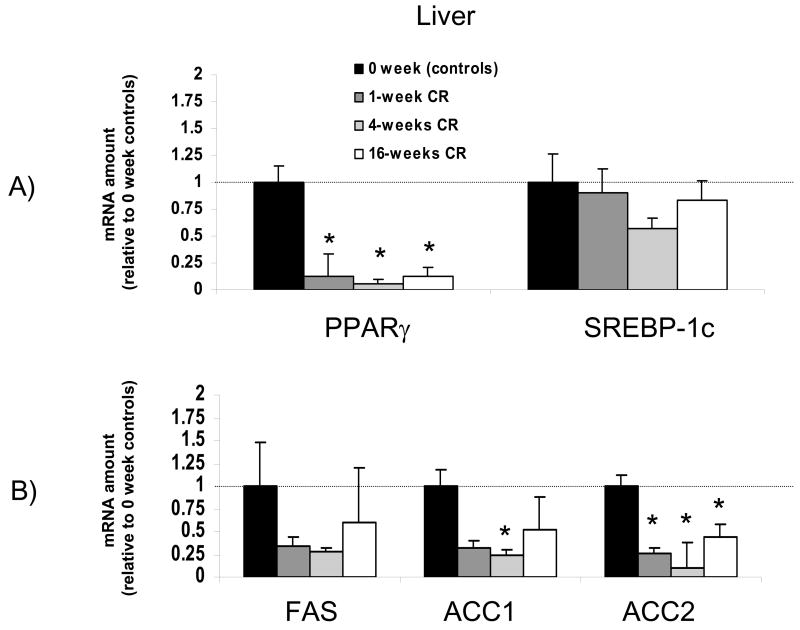
Figure 3.
Time course for the effects of calorie restriction on liver mRNA levels. The data from real-time PCR were normalized by 18 rRNA and are expressed relative to the control group (0 weeks of calorie restriction). Note that in liver PPARγ was decreased to less than 20% of baseline levels after only one week of a calorie restricted diet. N=4-5 per group * significantly different from control group

