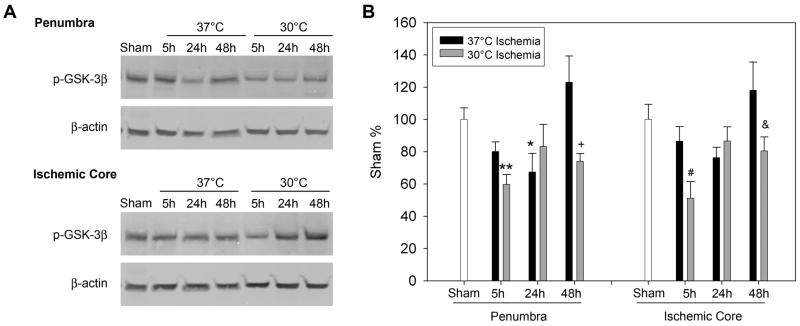
Fig. 2.
The effect of hypothermia on GSK3β phosphorylation. A. Representative protein bands of phosphorylated GSK3β from Western blot. β-actin was probed to show equal loading of protein. Rats subjected to normothermic or hypothermic stroke were euthanized at 5, 24 and 48 h later; ischemic penumbra and core were dissected for Western blot. B. Bar graphs show optical densities of protein bands of phosphorylated GSK3 β. In the penumbra, * p=0.043, ** P=0.006, vs sham. † vs 48h con, p=0.004; in the core, # vs sham and 5h con , P<0.05; & vs 48h con , P<0.05. n=5/group.

