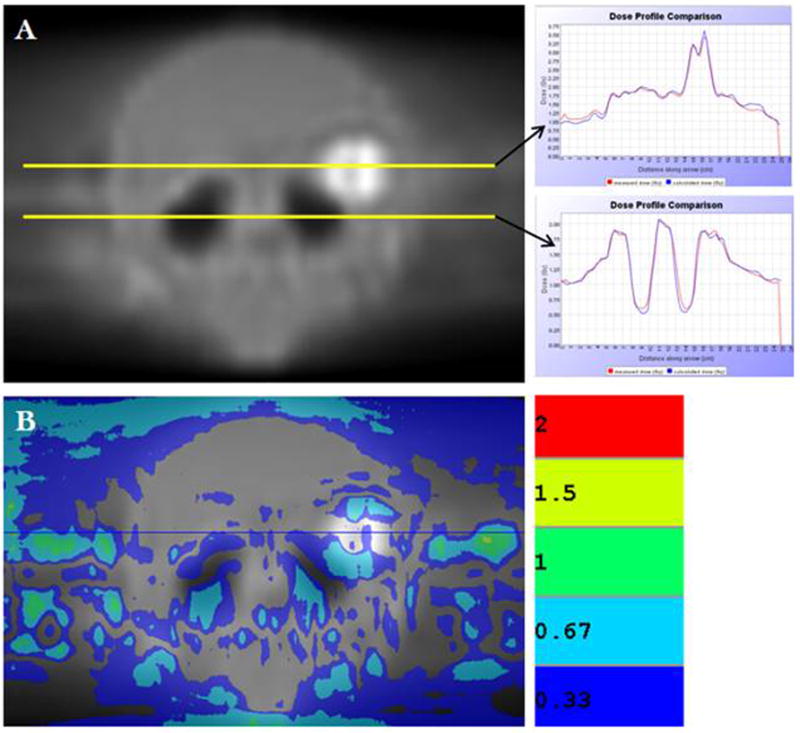
Figure 3.

(A) EDR2® film of coronal plane for sample patient treatment plan delivered in tomotherapy cylindrical solid water phantom. Profiles were acquired through metastasis (top yellow line) and hippocampus (bottom yellow line). Both profiles show superior correlation between measured and calculated dose distributions. (B) Gamma index distribution map between calculated and measured planar dose distributions shows good correlation.
