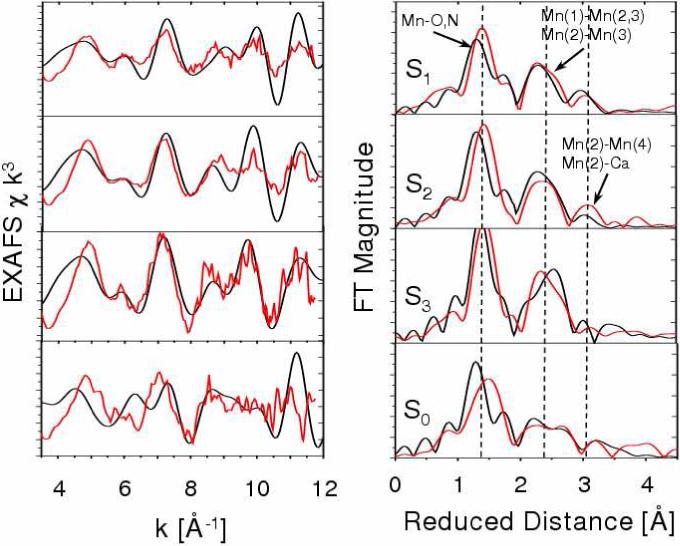
Figure 10.

Comparison between experimental (red) [41] and calculated [39] (black) EXAFS spectra of OEC S-state intermediates of water splitting. Left: k-weighted EXAFS spectra. Right: Fourier-transformed spectra in r-space, showing three prominent peaks corresponding to scattering centers in the first (O,N), second (Mn in the core), and third (dangling Mn, Ca) coordination shells of Mn, respectively. Vertical dashed lines are included to facilitate the comparison.
