
Figure 3. Luminal Alkalinization During Defecation.
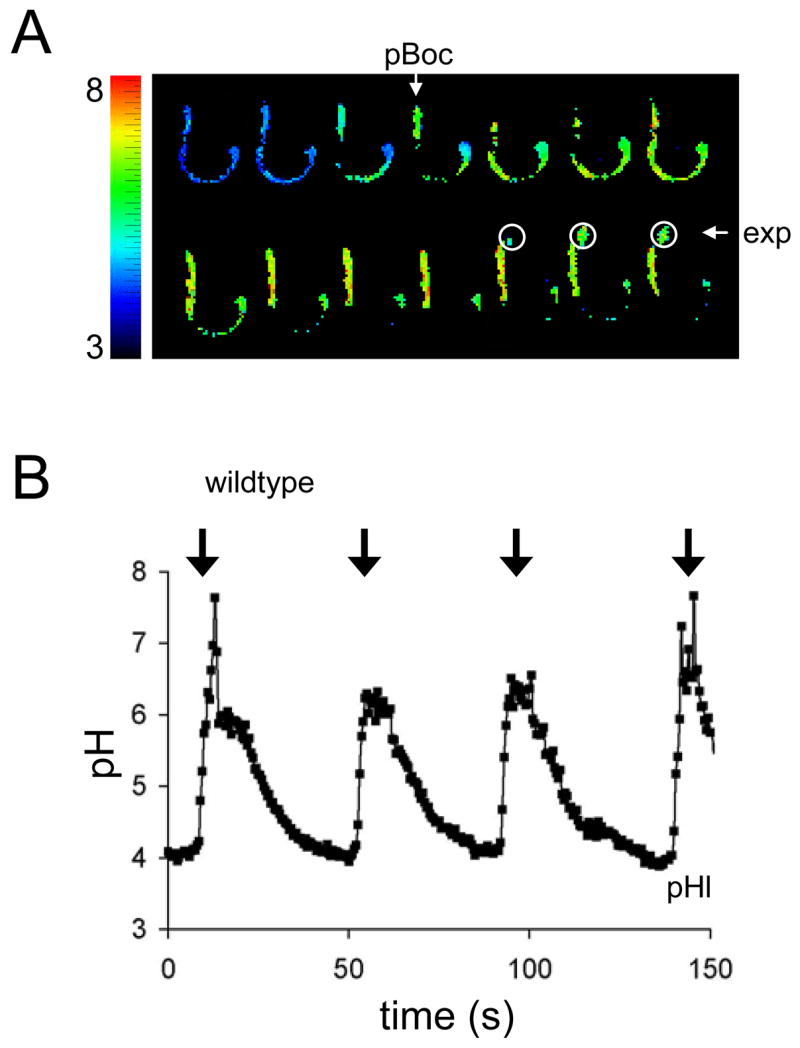
(A) Representative frames extracted from a time lapse acquisition of luminal pH (pHl) oscillations during defecation. Consecutive frames obtained at 2Hz are shown. Wildtype worms were fed dextran coupled to the pH sensitive vital dye Oregon Green-488. The fluorescent ratios (490-nm/440-nm dual excitation, 535-nm emission) obtained by imaging live worms during defecation were mapped to a rainbow palette, as indicated. The execution of pBoc and explusion are denoted. For orientation, the posterior end of the intestine is near the expelled luminal contents, encompassed by white circles. The plate is ~pH 6. In general, due to loading efficiency and retention of the dye, the worms used to obtain pHl measurements were larval rather than adult animals. (B) Representative trace of pHl oscillations during defecation in wildtype worms. The arrows denote pBoc. The ratios obtained from Oregon Green-488 imaging were converted to pH. Transient spikes in pHl above 6 are likely artifacts; as the ratio increases beyond the linear dynamic range of the calibration curve, small changes in ratio lead to progressively larger apparent changes in pH. A full description of this data can be found in Table S1.