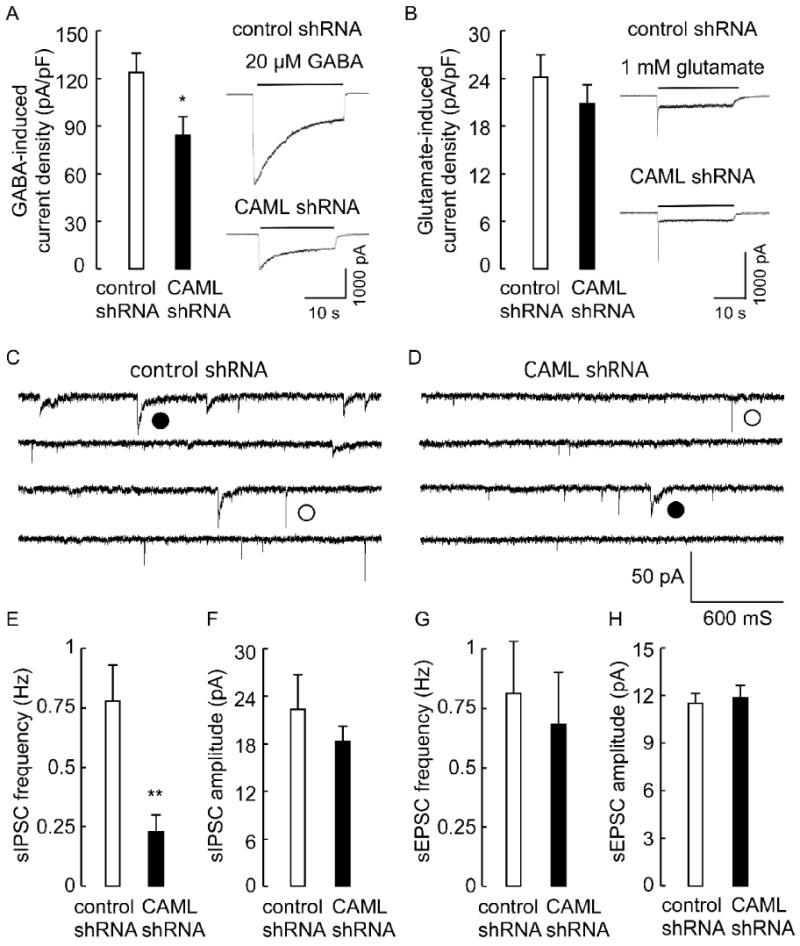
Figure 5. Functional analyses of CAML shRNA-transfected neurons.

A, B. Analysis of neurotransmitter-evoked whole cell currents revealed a significant reduction in the GABA (20 μM)-induced whole cell current density of CAML shRNA-transfected neurons (84.2 ± 12.3 pA/pF, n = 14 cells) compared to control shRNA-transfected neurons (123.6 ± 11.2 pA/pF, n = 16, p < 0.05) (A). In contrast, the glutamate (1 mM)-induced whole cell current density of CAML shRNA transfected neurons (20.8 ± 2.4 pA/pF, n = 14) was indistinguishable from controls (24.2 ± 2.8 pA/pF, n = 14, p = 0.37)(B). C, D, Current traces recorded from control (C) and CAML shRNA-transfected neurons (D), with representative sIPSCs and sEPSCs denoted with filled and open circles, respectively. E, F, The frequency of sIPSCs recorded from CAML shRNA-transfected neurons (0.23 ± 0.07 Hz) was significantly reduced compared to controls (0.78 ± 0.15 Hz, n = 15, p < 0.01)(E), whereas the amplitude of sIPSCs of CAML shRNA-transfected neurons was unaltered (CAML shRNA, 18.3 ± 1.9 pA, control 22.3 ± 4.4 pA, n = 15, p = 0.42)(D). G, H, The frequency and amplitude of sEPSCs recorded from CAML shRNA-transfected neurons (0.68 ± 0.22 Hz, 11.9 ± 0.78 pA, n = 15) was not different from controls (0.81 ± 0.22 Hz, p = 0.68, 11.5 ± 0.61 pA, n = 15, p = 0.75). Data represent means ± S.E; * p < 0.05, ** p < 0.01, Student's t-test.
