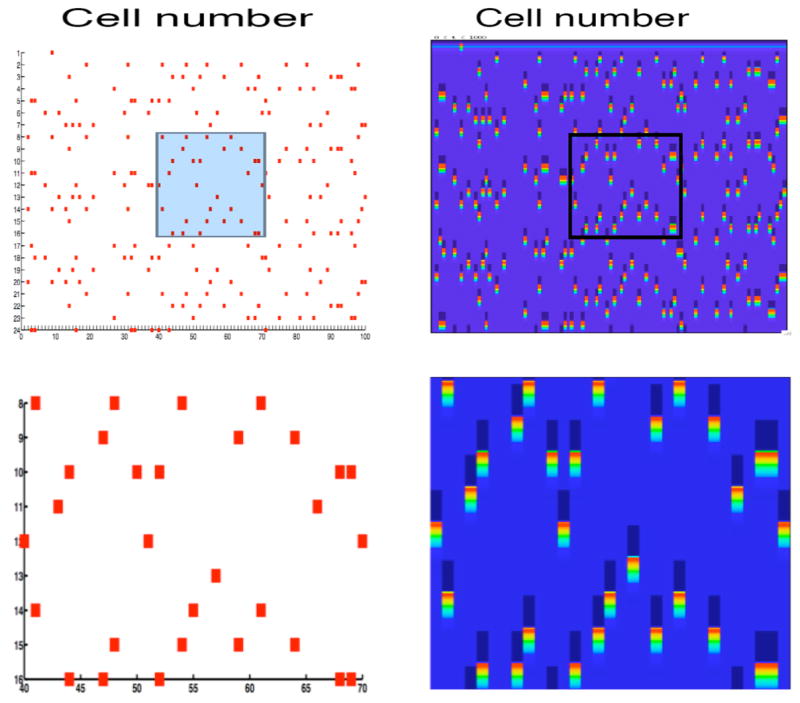
Figure 10.

Solutions of the discrete model (left) and neuronal model (right) for a network of 100 excitatory and 100 inhibitory cells. Each E-cell effectively inhibits nine other E-cells chosen at random. In this example, the refractory period is one and the length of the attractor is nineteen. The top panels show the full network and the bottom panel shows a blow-up of the rectangular regions highlighted in the top panel. In the right panels, the bright areas indicate when a neuron fires; the dark areas indicate when a neuron receives inhibition.
