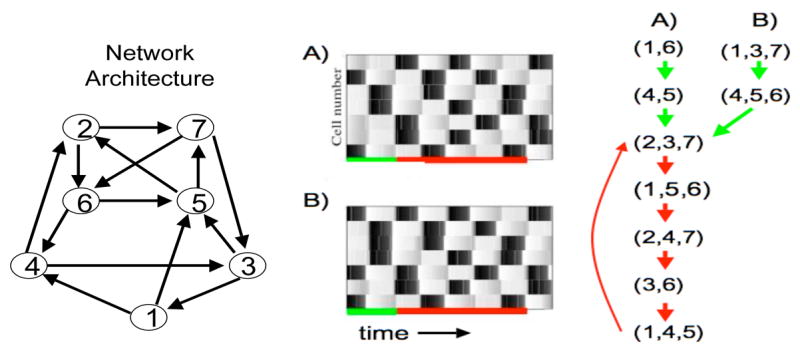
Figure 4.

An example inhibitory network with seven cells. The left panel shows the graph of the network architecture. Cell 1, for example, sends inhibition to cells 4 and 5. Subsets or clusters of cells fire in distinct episodes. Each horizontal row in the middle panels represents the time course of a single cell. A black rectangle indicates when the cell is active. In the right panel, we keep track of which cells fire during each subsequent episode. The equations and parameters used are precisely those described in Section 7 except , αx = 1, βx = 4, I = 16 for the E-cells and I = 10 for the I-cells.
