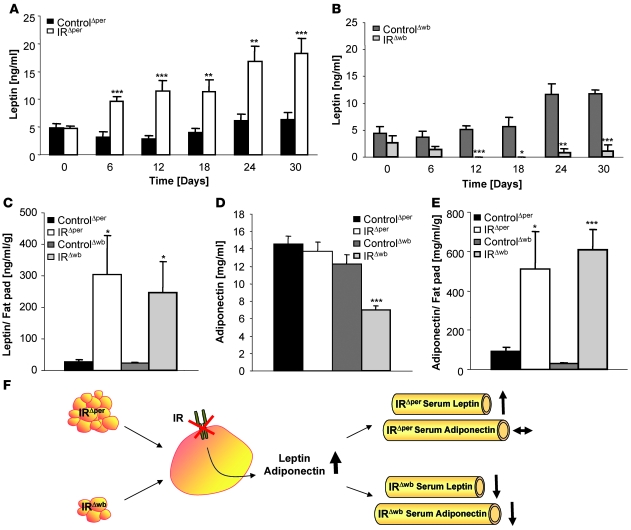
Figure 6. Insulin inhibits cell-autonomous leptin secretion.
(A) Serum leptin levels of 14-week-old ControlΔper (n = 18) and IRΔper mice (n = 18) over a period of 30 days. Values are mean ± SEM. **P ≤ 0.01, ***P ≤ 0.001 versus control. (B) Serum leptin levels of 14-week-old ControlΔwb (n = 5) and IRΔwb mice (n = 5) over the course of 30 days. Values are mean ± SEM. *P ≤ 0.05, **P ≤ 0.01, ***P ≤ 0.001 versus control. (C) Serum leptin levels correlated with epigonadal fat pad weight of 14-week-old ControlΔper (black bar; n = 17), IRΔper (white bar; n = 13), ControlΔwb (dark gray bar; n = 13), and IRΔwb mice (light gray bar; n = 6). Concentrations were measured 30 days after start of tamoxifen or doxycycline administration. Values are mean ± SEM. *P ≤ 0.05 versus control. (D) Serum adiponectin levels of 14-week-old ControlΔper (black bar; n = 13), IRΔper (white bar; n = 8), ControlΔwb (dark gray bar; n = 13), and IRΔwb mice (light gray bar; n = 18). Samples were taken 30 days after start of tamoxifen or doxycycline administration. Values are mean ± SEM. ***P ≤ 0.001 versus control. (E) Serum adiponectin levels correlated with epigonadal fat pad weight of 14-week-old ControlΔper (black bar; n = 13), IRΔper (white bar; n = 10), ControlΔwb (dark gray bar; n = 13), and IRΔwb mice (light gray bar; n = 16). Samples were taken 30 days after start of tamoxifen or doxycycline administration. Values are mean ± SEM. *P ≤ 0.05; *P ≤ 0.001 versus control. (F) General scheme for the effects of insulin resistance on circulating leptin and adiponectin levels. As a result of the loss of peripheral IR signaling, leptin and adiponectin secretion is disinhibited, resulting in an increase in circulating concentrations, still detectable in the raised leptin levels of IRΔper mice. However, in IRΔwb mice this effect is masked by a dramatic reduction in WAT mass.

