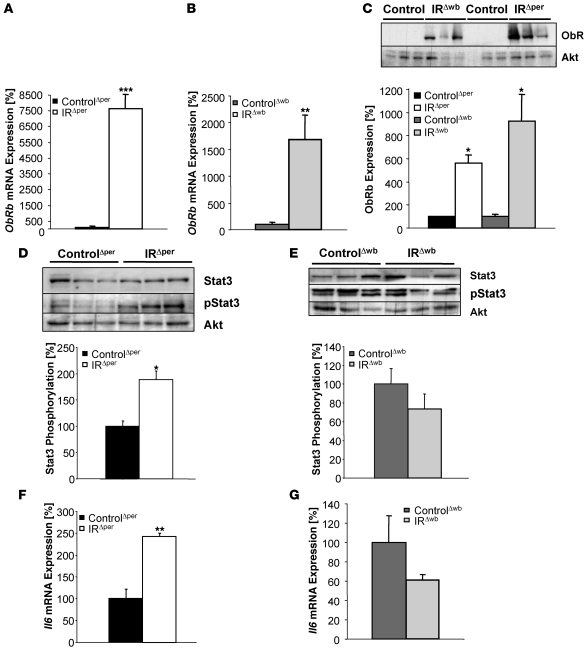
Figure 7. Effects of insulin resistance on leptin receptor expression, Stat3 phosphorylation, and Il6 mRNA expression in liver of 14-week-old IRΔper and IRΔwb mice.
Relative mRNA expression of hepatic ObRb of (A) ControlΔper (black bar; n = 8) and IRΔper (white bar; n = 7) mice and (B) ControlΔwb (dark gray bar; n = 5) and IRΔwb (light gray bar; n = 4) mice. (C) Western blot and densitometric analysis of hepatic ObRb and Akt (loading control) of ControlΔwb (n = 3), IRΔwb (n = 3), ControlΔper (n = 9), and IRΔper (n = 9) mice, with mean ObRb expression of controls set to 100%. (D) Western blot and densitometric analysis of hepatic Stat3, phosphorylated Stat3, and AKT of ControlΔper (n ≥ 6) and IRΔper (n ≥ 6) mice, with mean phosphorylated Stat3 in ControlΔper mice set to 100%. (E) Western blot and densitometric analysis of hepatic Stat3, phosphorylated Stat3, and Akt of ControlΔwb and IRΔwb mice, with mean phosphorylated Stat3 in ControlΔwb mice set to 100%. n ≥ 3 mice per group for Stat3 and n ≥ 7 mice per group for phosphorylated Stat3 analysis. Relative mRNA expression of hepatic Il6 in (F) ControlΔper (black bar; n = 8) and IRΔper (white bar; n = 7) mice and (G) ControlΔwb (dark gray bar; n = 7) and IRΔwb (light gray bar; n = 7) mice. Samples were collected 30 days after starting each experiment. Values are mean ± SEM. *P ≤ 0.05, **P ≤ 0.01, ***P ≤ 0.001 versus control.

