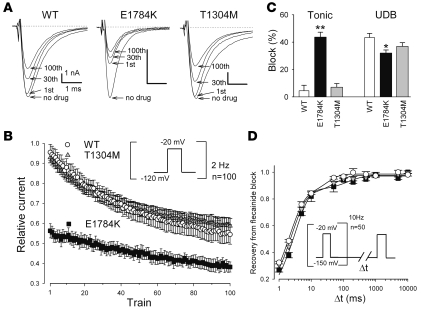
Figure 5. Tonic block and UDB by flecainide.
(A) Representative current traces of WT, E1784K, and T1304M before and after 10 μmol/l flecainide. A train of 100 pulses (to –20 mV for 20 ms) was applied at 2 Hz from a holding potential of –120 mV. Numbers indicate the first, 30th, and 100th pulse of the 2-Hz train. Zero current levels are indicated by dotted lines. (B) Time course of the peak current levels after application of 10 μmol/l flecainide. Peak current levels recorded with each pulse were normalized to the baseline prior to flecainide treatment. (C) Tonic block, determined by the first test pulse after application of flecainide, was weak in WT (4.5% ± 4.0%, n = 5) and T1304M (7.1% ± 2.7%, n = 5; P = NS) but was remarkably enhanced in E1784K (43.7% ± 8.0%, n = 5; **P < 0.001). Conversely, UDB, determined by the difference between first and 100th pulses relative to the first pulse, was slightly attenuated in E1784K (WT, 43.4% ± 3.0%; E1784K, 32.0% ± 2.2%; *P < 0.05), but not in T1304M (36.9% ± 2.7%; P = NS). Net flecainide block at the 100th train was significantly enhanced in E1784K (WT, 45.5% ± 5.0%; E1784K, 61.8% ± 2.5%; P < 0.01) but not in T1304M (41.2% ± 3.2%; P = NS). (D) Recovery from flecainide block. Cells were held at a potential of –150 mV and superfused with 30 μmol/l flecainide, and a train of 50 pulses (to –20 mV for 20 ms) at 10 Hz was applied to block Na channels. The pulse protocol cycle time was 60 s. Recovery from block was then assessed by a –20-mV test pulse applied after varying the duration of a –150-mV repolarization period (Δt). Peak current was normalized, and the data were fit to a double exponential function.

