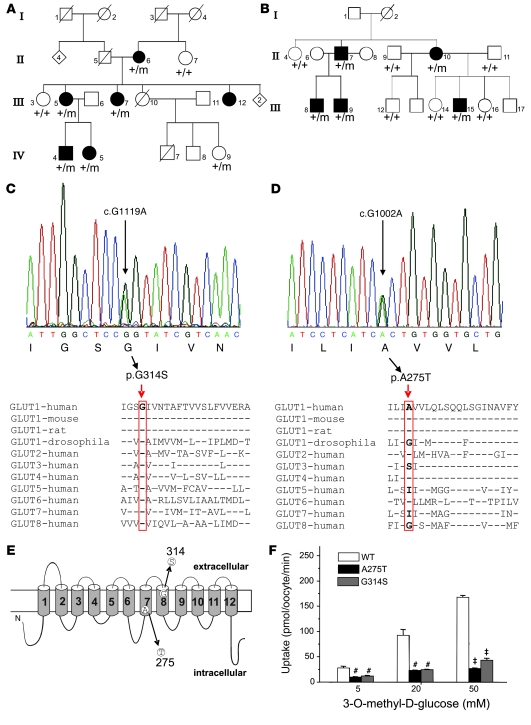
Figure 5. Genetic and functional analysis of further families with PED.
(A) Partial pedigree of family PED2 (see ref. 24 for full pedigree). Individuals affected by PED, epilepsy, mild mental retardation, and impulsivity are shown as filled symbols, and open symbols represent unaffected individuals. Symbols with diagonal lines represent deceased individuals. (B) Pedigree of family PED4 (modified after ref. 26; see text). Filled symbols denote individuals affected by PED. +/+ denotes 2 WT alleles, whereas +/m denotes heterozygous mutation carriers. (C and D) DNA sequences shown for patients III-5 from family PED2 and II-7 from PED4 reveal point mutations c.G1119A (C) and c.G1002A (D), predicting the substitutions p.G314S and p.A275T, respectively. Lower panels show G314 is highly, while A275 is a bit less, conserved among species and other glucose transporters. (E) Localization of the 2 novel mutations in transmembrane domains 7 and 8 of GLUT1. (F) Glucose uptake in oocytes was reduced for both mutations (shown are representative results recorded from 1 batch of 3 × 10 oocytes for each glucose concentration, mean ± SEM; #P < 0.01, ‡P < 0.001).

