
Figure 3.
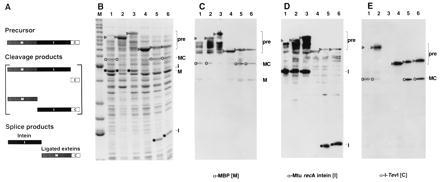
Splicing in vivo. (A) Schematic of the MIC in-frame fusion. Precursor, cleavage, and splice products are shown. (B) Twelve percent Coomassie-stained SDS polyacrylamide gel of cell lysates of MIC constructs induced at 37°C for 3 h. Lane M, molecular mass marker bands (Benchmark, GIBCO/BRL) from the bottom up correspond to 15, 20, 25, 30, 40, 50, 60, 70, 80, 90, 100, 120, 160, and 220 kDa (bold numbers correspond to the two high-intensity bands). Lanes: 1, full-length MIC; 2, MIC25, a slow-splicing mutant derivative of full-length MIC (D.W.W. et al., unpublished results); 3, MIT with TS as C-terminal extein; 4, 101Δ405(A7) (Fig. 2, construct 3); 5, 110Δ383 (Fig. 2, construct 6); 6, 114Δ372 (Fig. 2, construct 8). ▹, precursor (MIC or MIT); ○, ligated exteins (MC); •, intein. Arrowheads in lane 1 mark position of precursor. (C) Western blot of 12% SDS polyacrylamide gel with maltose binding protein antiserum. (D) Western blot of 12% SDS polyacrylamide gel with Mtu recA intein antiserum. (E) Western blot of 10% SDS polyacrylamide gel with I-TevI antiserum. The assignments were verified on a 12% gel (data not shown). Background bands from cross-reactivity to the polyclonal antisera are also evident in C–E. Lanes and symbols are as in B.