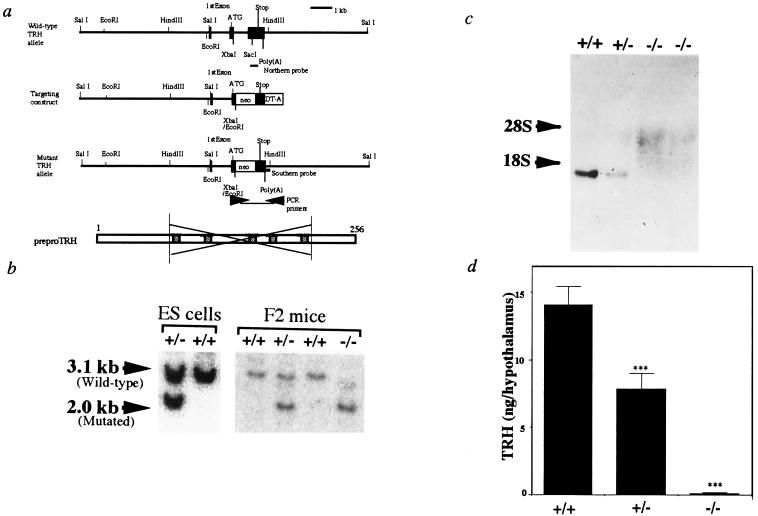
Figure 1.
Targeted disruption of the pTRH gene. (a) Schematic representation of the mouse pTRH gene (Upper), targeting vector, expected targeted allele, and pTRH (Lower). Solid boxes represent exons. Allele-specific PCR primers for selection of homologous recombinants are indicated by arrows, and probes for Southern and Northern blot analyses are also indicated. Hatched bars represent TRH progenitor sequences in pTRH. (b) Southern blot analysis of DNA from ES cell clones and siblings generated by crossing heterozygous mice (F2 mice). The wild-type (3.1 kb) and targeted (2.0 kb) HindIII and EcoRI fragments were detected by the 3′ external probe indicated in a. (c) Analysis of pTRH mRNA expression by Northern blot analysis of F2 mice. Total RNAs (20 μg) from the hypothalamus of wild-type (+/+), heterozygous (+/−), and homozygous mice (−/−) were hybridized with pTRH cRNA. (d) Hypothalamic TRH contents of the wild-type (+/+, n = 9), heterozygous (+/−, n = 5), and homozygous (−/−, n = 10) mice. ∗∗∗, P < 0.001 vs. wild type.

