
Figure 2. The N-Terminal Region of Rad52 Promotes Post-Invasion Steps of Meiotic Recombination.
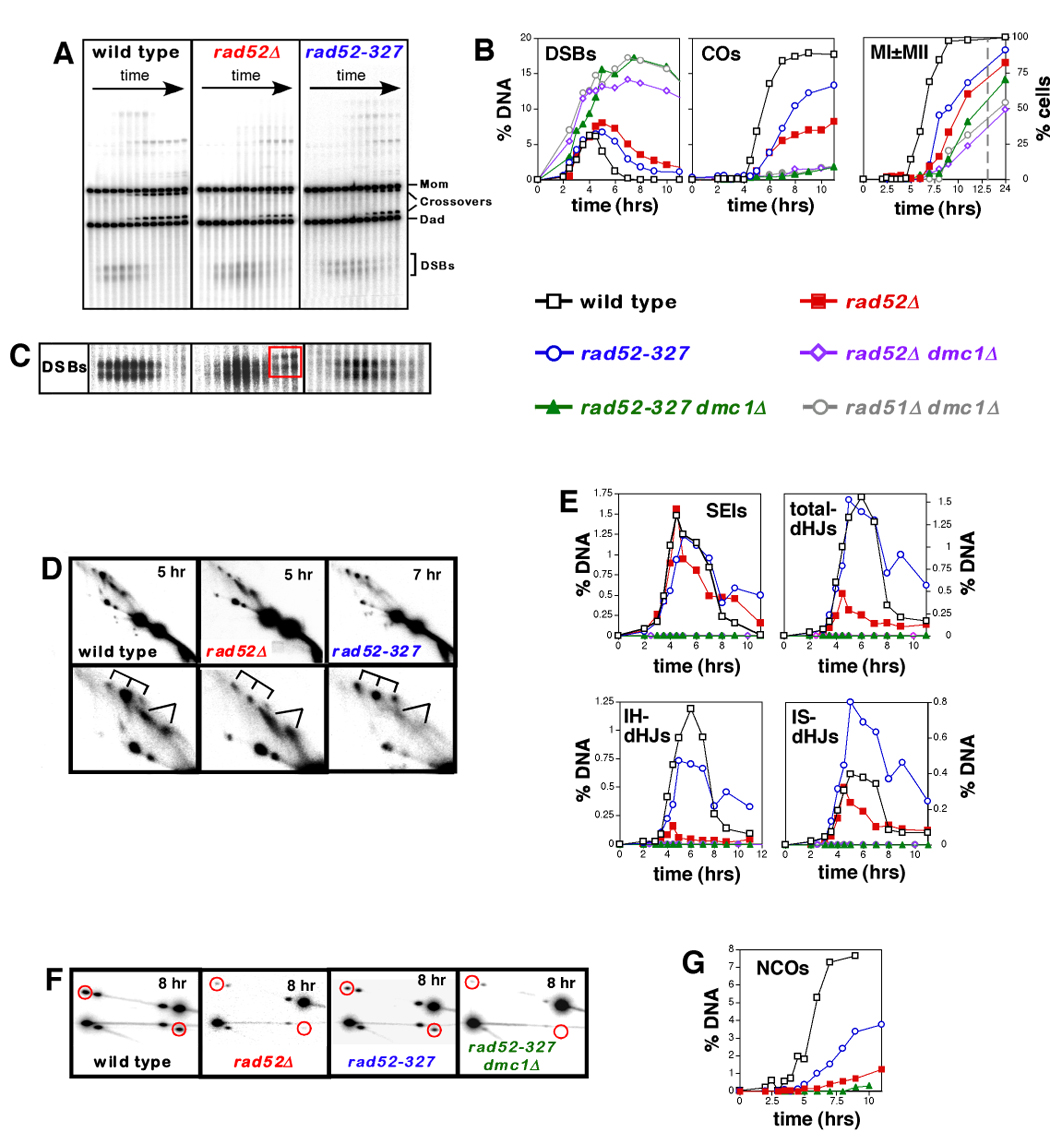
(A). Images of 1D gels from wild-type, rad52Δ and rad52-327 time course experiments.
(B) Quantitation of DSBs and crossovers (COs), and analysis of meiotic divisions (MI±MII) in wild type, rad52Δ and rad52-327 strains, and control strains (rad52Δ dmc1Δ, rad52-327 dmc1Δ and rad51Δ dmc1Δ). % DNA is percent of total hybridizing DNA. MI±MII are cells that have completed either the first or second meiotic divisions, as determined by the number of DAPI staining bodies. The dashed grey line marks a break in the X-axis.
(C) Dark exposures of the DSB regions from 1D gels, highlighting the late forming species formed in rad52Δ cells (see Figure S2).
(D) 2D analysis of joint molecules (JMs). In each case, a representative 2D panel is shown together with a blowup of the JM region. SEI and dHJ species are indicated by forked lines and tridents, respectively.
(E) Quantitation of JM formation in wild type, rad52Δ and rad52-327. No JM species were detected in control strains, rad52Δ dmc1Δ, rad52-327 dmc1Δ and rad51Δ dmc1Δ.
(F) Noncrossover analysis for wild-type, rad52Δ, rad52-327 and rad52-327 dmc1Δ time-course experiments (see Figure 1E for details). Each panel shows a representative late time point. Red circles highlight noncrossover signals.
(G) Quantitation of noncrossover formation in wild-type, rad52Δ, rad52-327 and rad52-327 dmc1Δ strains.