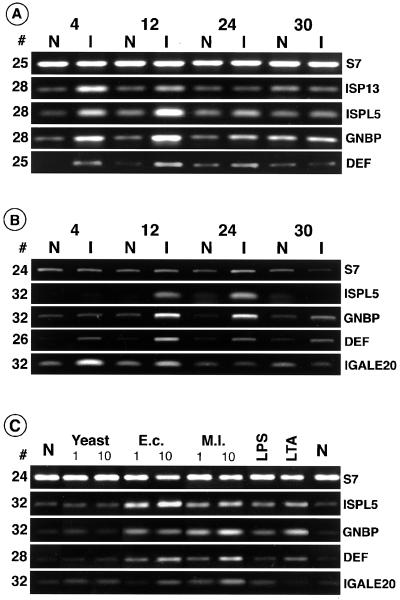
Figure 3.
Expression profiles of immune markers in bacterially challenged (I) larvae (A) and adults (B) at 4, 12, 24, and 30 hr after infection compared with unchallenged naive animals (N). Changes in expression levels of specific sequences are detected relative to the control ribosomal protein S7 transcript. In this and subsequent figures the PCR cycle number for each sequence is indicated to the side of the data panel. The induction profiles of ISP13 and defensin in larvae were reported previously (11, 12). [Part of A reproduced from ref. 11 with permission (Copyright 1996, Royal Entomological Society) and part modified from figure 2 in ref. 12.] (C) Background levels of the markers in naive cells (N) and induced levels (I) after challenge with 10-fold differing concentrations of yeast, E. coli (E.c) and M. luteus (M.l.), or with LPS and LTA at concentrations as indicated in Materials and Methods.

