Figure 3.

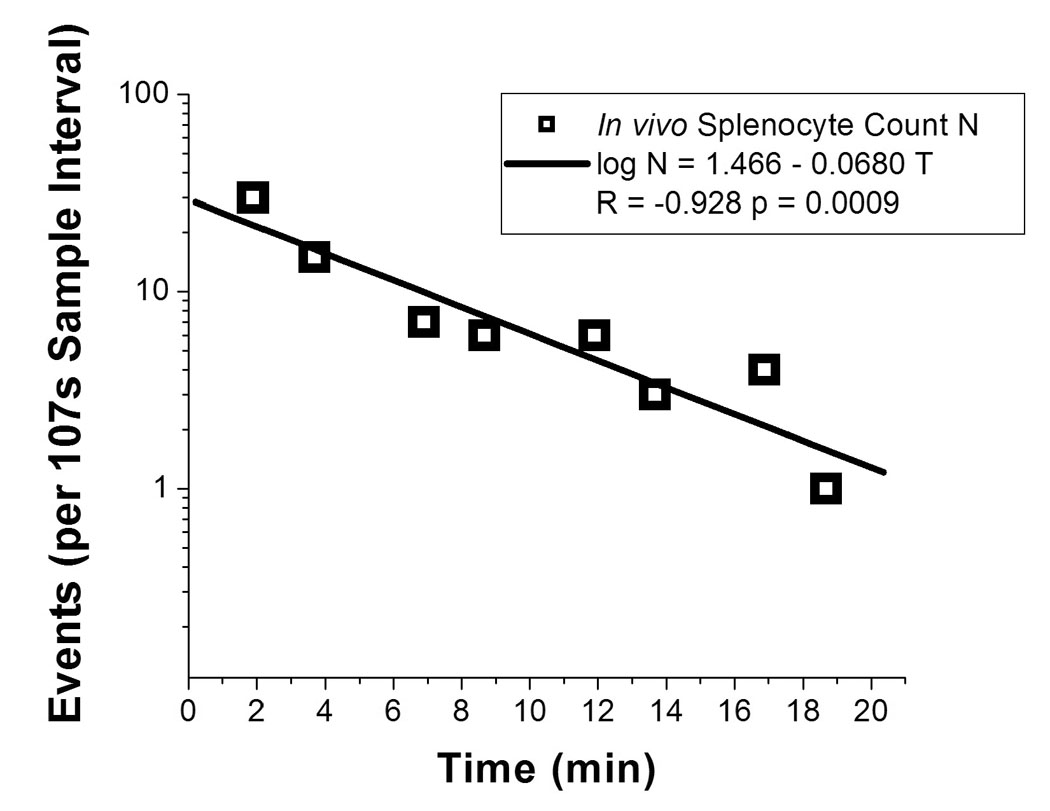
Depletion dynamics of injected cells. Number of detected events (log scale) are plotted over 20 minutes after the injection of 3.6 × 10⁶ DeepRed-labeled splenocytes at time 0.

Depletion dynamics of injected cells. Number of detected events (log scale) are plotted over 20 minutes after the injection of 3.6 × 10⁶ DeepRed-labeled splenocytes at time 0.