Fig. 1.

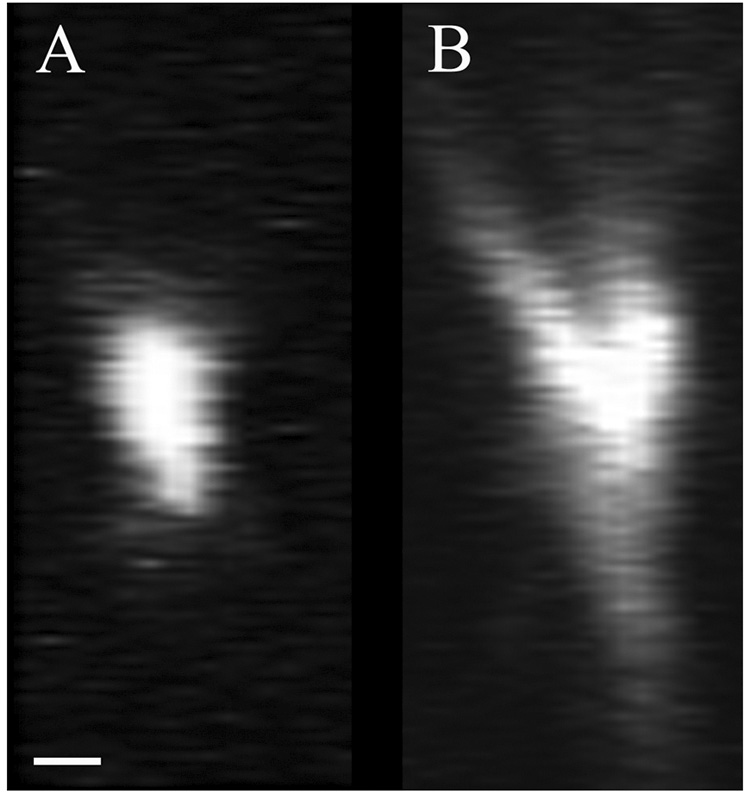
Comparison of XZ cross sectional images of 1micron fluorescent microsphere collected below 50 microns of aqueous solution (A) and below 50 microns of fixed kidney tissue (B). Scalebar = 1 micron, x=z.

Comparison of XZ cross sectional images of 1micron fluorescent microsphere collected below 50 microns of aqueous solution (A) and below 50 microns of fixed kidney tissue (B). Scalebar = 1 micron, x=z.