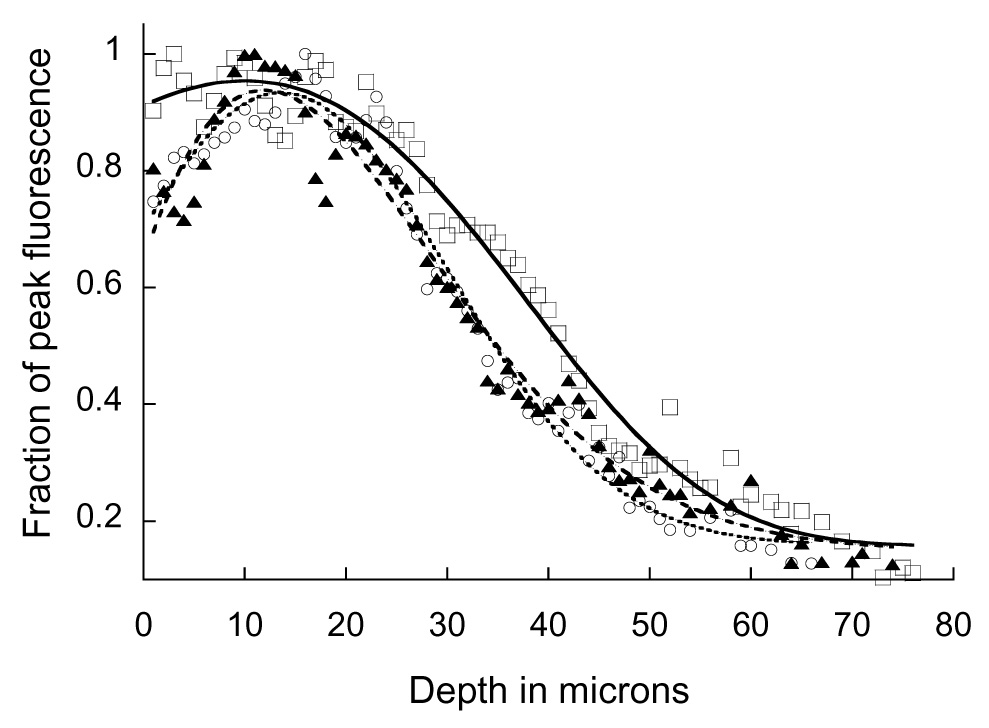
Fig. 3.

Effect of correction collar adjustment on fluorescence intensity as a function of depth in kidney tissue. Multiphoton fluorescence images of nuclei labeled with Hoechst 33342 were collected at various depths from the kidney of a living rat, using collar settings of 0.14 (▲), 0.17 (○), 0.19 mm (□). Mean fluorescence intensity of each plane is plotted, normalized to the peak of each plot. Curves included to guide the eye.
