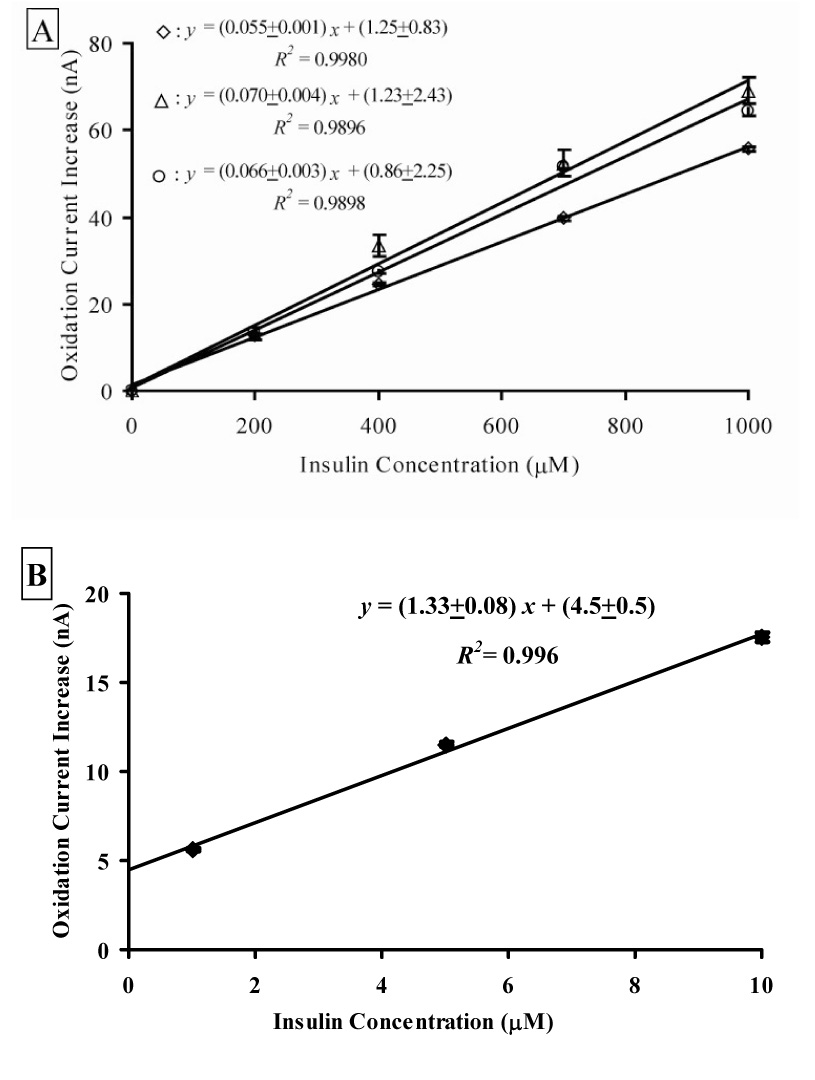
Fig. 5.

Insulin calibration curves of MWCNT/DHP films at + 0.88 V vs. Ag/AgCl (2 M KCl). Insulin was added as a solution in 50 mM phosphate buffer (pH 7.4, 0.02% v/v Tween-80). Buffer was also added as a control. (A) Calibration curves of three different films on a 3 mm GCEs, performed under moderate stirring with each point showing the current increase for that concentration. Each data point on the graph represents twenty seconds or 200 collected data points. (B) Calibration curve of a MWCNT/DHP film on a 1 mm GCE of a modified sensor head in the MAMP microfluidic chamber under diffusion control. Each data point on the graph represents at least five flow – stop flow cycles, comprising 700 collected data points.
