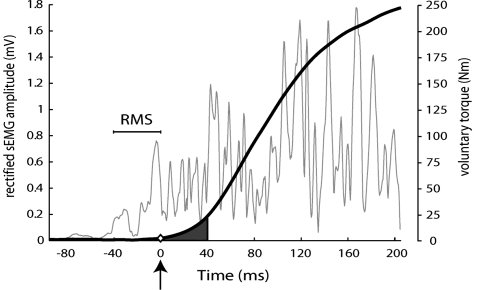
Fig. 1.
Voluntary torque (thick line) and rectified surface EMG of the vastus lateralis muscle (thin line) time traces, obtained from a representative subject during an isometric voluntary knee extension performed as fast and forcefully as possible. The arrow and diamond at time 0 ms indicate the start of voluntary torque development. The shaded area under the voluntary torque trace reflects the vTTI40, calculated the first 40 ms after onset of torque development. The horizontal bar indicates the 40 ms immediately preceding the onset of torque development (i.e., from −40 to 0 ms) for which the root mean square (RMS) of the surface EMG was calculated. Subsequently, both vTTI40 and RMS−40–0 were normalized to the steady state maximal isometric knee extension condition at the day of testing

