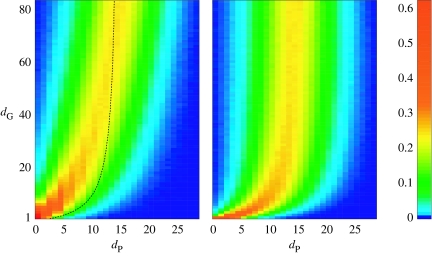
Figure 4.
Genotype-map structure as seen from a group of genotypes in two different numerical experiments ((I,O,H,M, 〈k〉)=(3, 4, 8, 3, 3.0)). (a) From 103 random wirings, the histogram of phenotypic distances of 10 other wirings at progressively higher distances starting at them. (b) The same histogram starting at the 80 selected genotypes with increased mutational diversity. The average phenotypic distance of the right part is plotted as a dashed black line in the left part for comparison.

