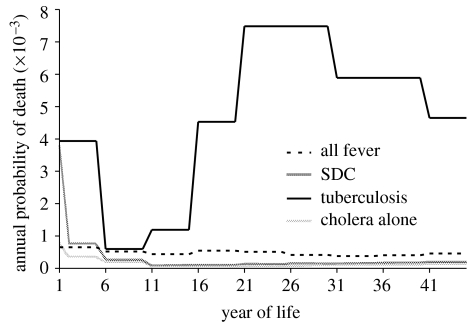
Figure 1.
Age-specific probability of death owing to candidate diseases from historical records (Woods & Shelton 1997). Tuberculosis curve represents the peak of the European epidemic during 1600–1900, with 20% of all-cause mortality; the rates we used prior to 1600 were fractions of the same curve. SDC refers to secretory diarrhoea including cholera, and hence includes diarrhoea due to E. coli.

