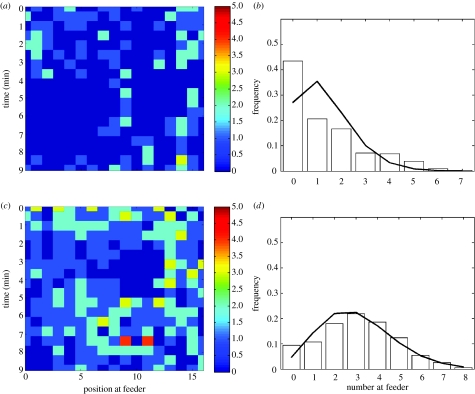
Figure 3.
Results from observations of bird feeding patterns. Example of activity at different sections along the feeder through 10 min for (a) an average density of 0.44 and (c) an average density of 1.02 chickens per feeding position. Distribution of number of chickens feeding per three adjacent feeding sections over the 10 min is given in (b) and (d), respectively. Fitted lines show the distribution of number of chickens given a Poisson distribution.

