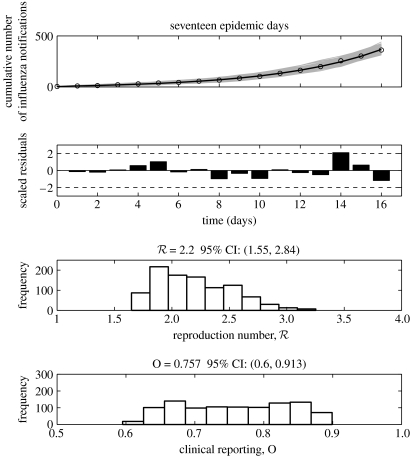
Figure 5.
Model fits, residuals plots and the resulting distributions of the reproduction number and the proportion of the clinical reporting obtained after fitting the complex SEIR epidemic model (Method 3) to the initial phase of the autumn influenza wave using 17 epidemic days of the Spanish flu pandemic in San Francisco, California. In the top panel, the epidemic data of the cumulative number of reported influenza cases are the circles, the solid line is the model best-fit and the solid grey lines are 1000 realizations of the model fit to the data obtained through parametric bootstrapping as explained in the text.

