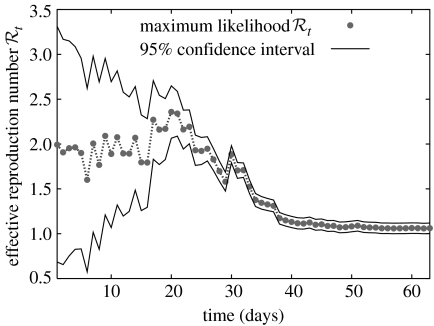
Figure 6.
Sequential Bayesian estimation of the full distribution of leads to the estimation of its maximum-likelihood value (grey dots) and 95% CIs (solid black lines). Uncertainty, measured by the width of the CI, decreases with more case observations. The estimates eventually lead to smaller owing to depletion of susceptibles. At late times, as a result of averaging periods in which the epidemic grows and declines.

