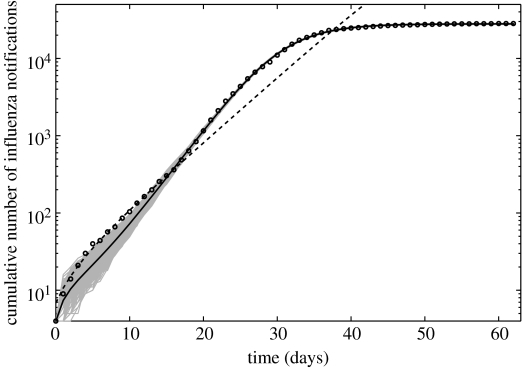
Figure 7.
The complex SEIR model fit (solid line) to the entire epidemic curve (circles) and the simple SEIR model fit (dashed line) calibrated using the initial exponential phase (17 days) are shown for comparison (cumulative cases are shown in logarithmic scale). Solid grey lines are 1000 realizations of the complex SEIR model fit to the data obtained through parametric bootstrapping as explained in the text.

