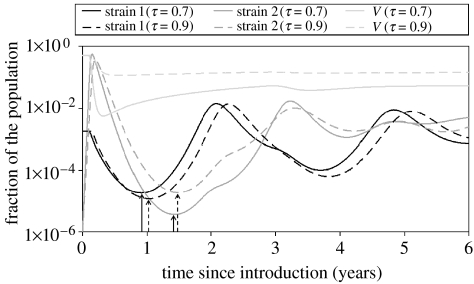
Figure 3.
Deterministic trajectories, obtained by the numerical integration of equations (2.1), following the introduction of strain 2 with an incidence of 10−6. Black lines show the incidence (infected fraction of the population) of strain 1, darker grey lines that of strain 2 and lighter grey lines the fraction in the vaccinated compartment V. Solid lines, vaccine cross-protection τ=0.7; dashed lines, τ=0.9. Arrows point at post-epidemic troughs, as recorded in figures 5 and 6. Other parameter values are as in figure 2, except vaccine immune period 1/σV=50 years.

