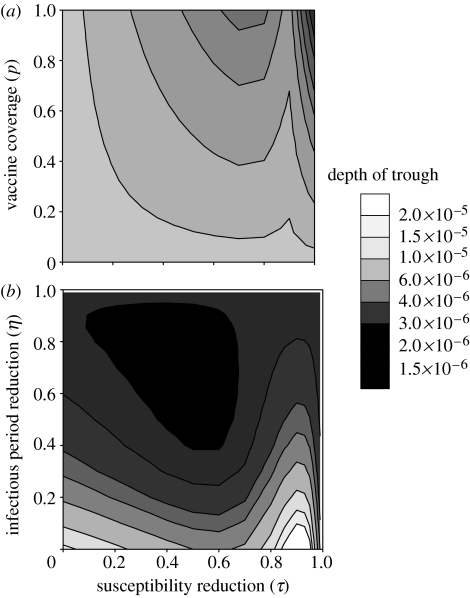
Figure 4.
Trough depth of strain 2 plotted against the reduction in susceptibility through vaccine cross-immunity (τ) on the horizontal and the vertical axes: (a) vaccine coverage p and (b) reduction in infectious period through vaccine cross-immunity η. Other parameter values are as in figure 2, except (b) ν=0.5.

