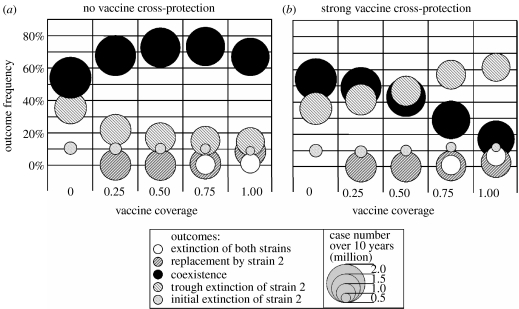
Figure 6.
Summary of 10 series of 1000 stochastic simulations, for two values of vaccine cross-protection ((a) τ=0, (b) τ=0.7) and five values of vaccine coverage (horizontal axis). In each series, we recorded the frequencies (vertical scale) of the five possible outcomes (pattern coded) and the corresponding number of cases (the diameter of bubbles represents the average number for each outcome) in the 10 years that follow the introduction of strain 2. Other parameters are as in figure 5, except natural cross-protection θ=0.5.

