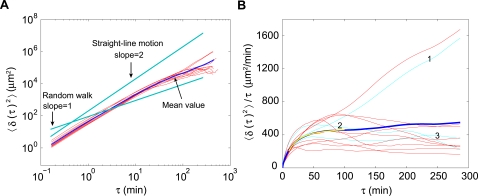
Figure 3. Mean-squared displacement.
(A) Log-log plot of the mean-squared displacement vs time interval τ. (B) Mean-squared displacement divided by τ plotted as a function of τ. Random walk would gives rise to a line with zero slope. Cyan, data from the 3 trajectories showed in Fig. 2; Red, additional 9 trajectories; Blue, average of all 12 trajectories. Yellow, fit of an exponential cross-over from directed to random walk in the interval τ [10∶100] min: 〈δ(τ)2〉 = 2tpv 2(τ−tp(1−exp(−τ/tp))), where v = 5.4±0.1 µm/min is a characteristic speed, and tp = 8.8±0.1 min is a persistence time.

