
Fig. 6.
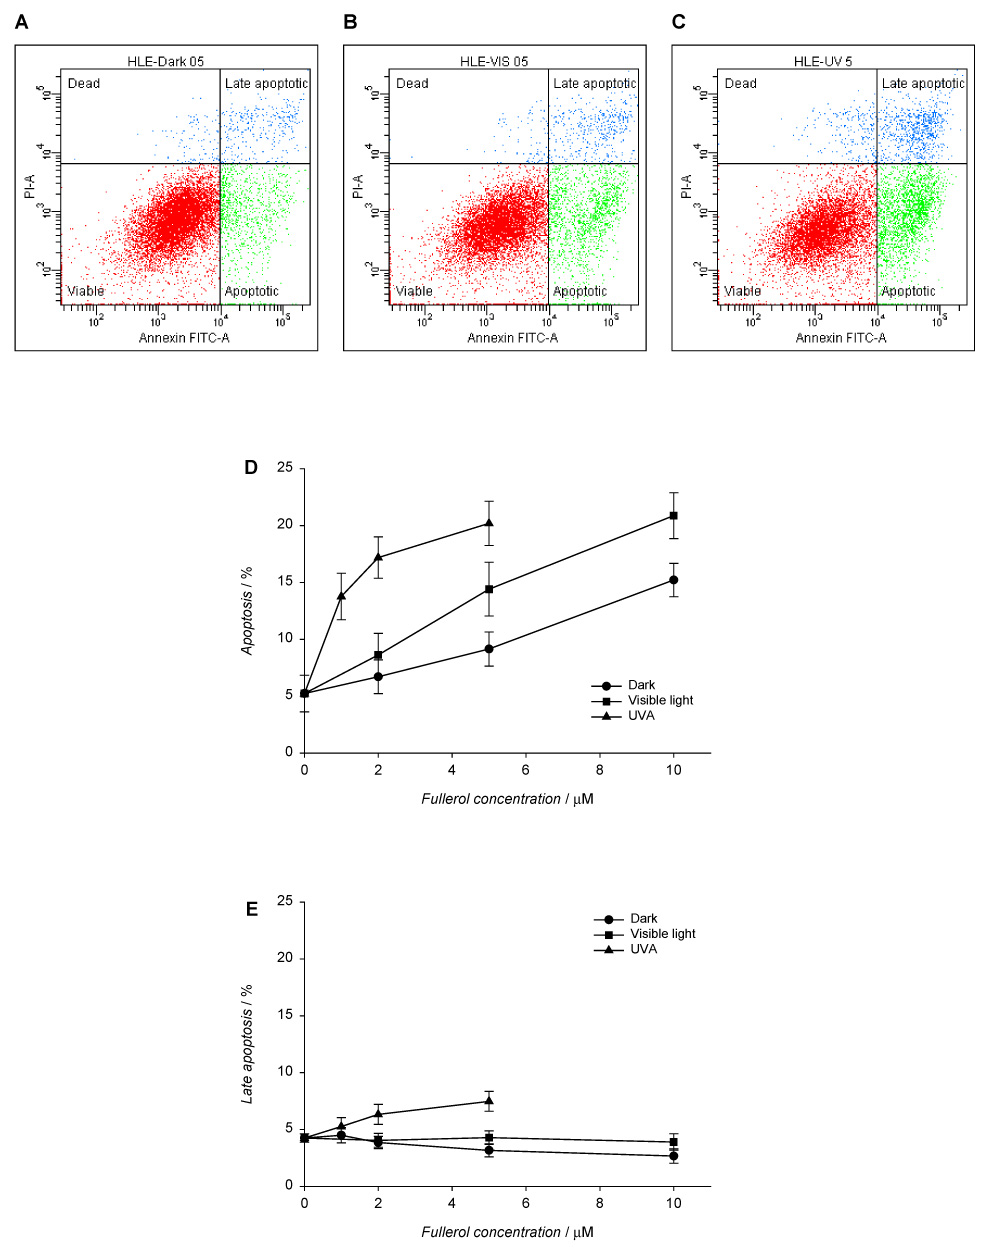
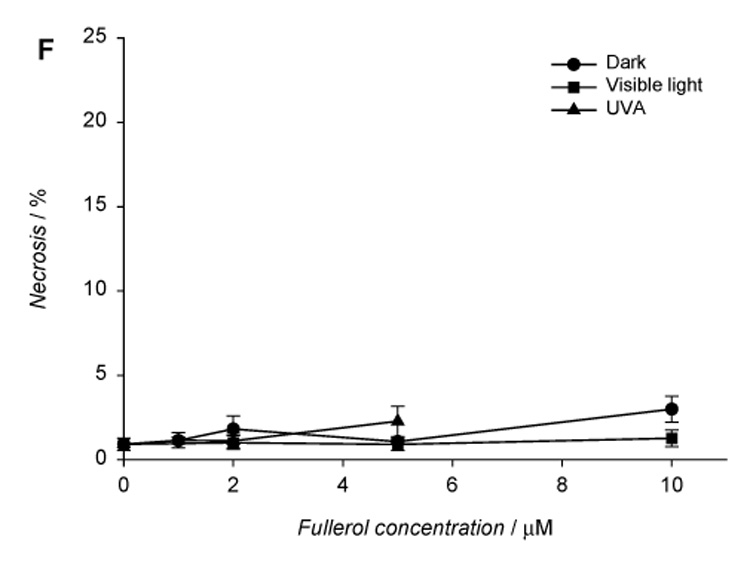
Fullerol-induced apoptotic and necrotic death in human lens epithelial cells. The cells were incubated with fullerol in HBSS/DMSO (99:1) in the dark for 17 h and exposed to visible light (1 h) or UVA (10 min). After irradiation, the cells were incubated overnight in MEM/FBS (8:2) and then stained with Annexin V-FITC and propidium iodide. Apoptotic and necrotic cell death were determined with flow cytometry. Histograms A–C show populations of HLE cells preincubated with 5 µM fullerol in the dark (A) and after exposure to visible light (B) or UVA (C). The graphs illustrate the number cells in apoptotic (D), late apoptotic (E), and necrotic state normalized to the total number of counted cells (F). Values in D–F graphs are expressed as mean ± range (n=2).