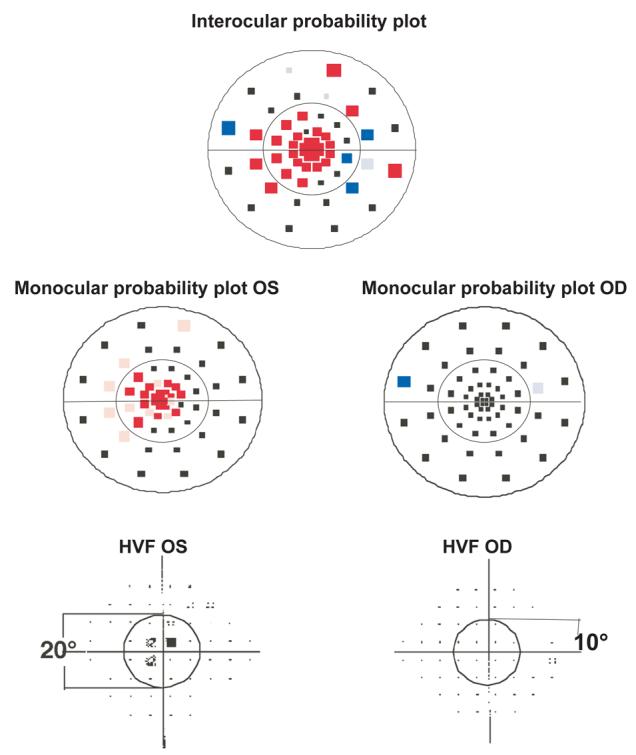
Figure 4.

Representative mfVEP probability plots and HVF total deviation plots obtained from one of the patients (P12). Abnormal clusters for the left eye can be seen in both the superior and inferior hemifields on the interocular probability plot and there is an abnormal cluster for the right eye in the inferior hemifield. The monocular probability plot for the left eye also shows abnormal clusters. The HVF total deviation plot for the left eye shows an abnormal cluster in the superior hemifield. The fellow eye or right eye is normal on the HVF.
